
Learning Objectives
Following this assignment students should be able to:
- practice basic syntax and usage of
forloops- use
forloops to automate function operations- understand how to decompose complex problems
Reading
-
Topics
- Iteration
- Problem decomposition
-
Readings
Lecture Notes
Exercises
-- Use and Modify with Apply --
This is a followup to Use and Modify.
-
Write a function that takes length as an argument to get an estimate of mass values for the dinosaur Theropoda. Use the equation
mass <- 0.73 * length ** 3.63, where 0.73 is a and 3.63 is b. Then usesapply()and the following vector of lengths to get a vector of estimated masses.theropoda_lengths <- c(17.8013631070471, 20.3764452071665, 14.0743486294308, 25.65782386974, 26.0952008049675, 20.3111541103134, 17.5663244372533, 11.2563431277577, 20.081903202614, 18.6071626441984, 18.0991894513166, 23.0659685685892, 20.5798853467837, 25.6179254233558, 24.3714331573996, 26.2847248252537, 25.4753783544473, 20.4642089867304, 16.0738256364701, 20.3494171706583, 19.854399305869, 17.7889814608919, 14.8016421998303, 19.6840911485379, 19.4685885050906, 24.4807784966691, 13.3359960054899, 21.5065994598917, 18.4640304608411, 19.5861532398676, 27.084751999756, 18.9609366301798, 22.4829168046521, 11.7325716149514, 18.3758846100456, 15.537504851634, 13.4848751773738, 7.68561192214935, 25.5963348603783, 16.588285389794) -
Rewrite the function with a and b as arguments, then use
mapply()to determine the mass estimates for the dinosaurs using the following vectors of a and b values for each dinosaur.a_values <- c(0.759, 0.751, 0.74, 0.746, 0.759, 0.751, 0.749, 0.751, 0.738, 0.768, 0.736, 0.749, 0.746, 0.744, 0.749, 0.751, 0.744, 0.754, 0.774, 0.751, 0.763, 0.749, 0.741, 0.754, 0.746, 0.755, 0.764, 0.758, 0.76, 0.748, 0.745, 0.756, 0.739, 0.733, 0.757, 0.747, 0.741, 0.752, 0.752, 0.748)b_values <- c(3.627, 3.633, 3.626, 3.633, 3.627, 3.629, 3.632, 3.628, 3.633, 3.627, 3.621, 3.63, 3.631, 3.632, 3.628, 3.626, 3.639, 3.626, 3.635, 3.629, 3.642, 3.632, 3.633, 3.629, 3.62, 3.619, 3.638, 3.627, 3.621, 3.628, 3.628, 3.635, 3.624, 3.621, 3.621, 3.632, 3.627, 3.624, 3.634, 3.621)
-
-- Crown Volume Calculation --
The UHURU experiment in Kenya has conducted a survey of Acacia and other tree species in ungulate exclosure treatments. Data for the tree data is available here in a tab delimited (
"\t") format. Each of the individuals surveyed were measured for tree height (HEIGHT) and canopy size in two directions (AXIS_1andAXIS_2). Read these data in using the following code:tree_data <- read.csv("http://www.esapubs.org/archive/ecol/E095/064/TREE_SURVEYS.txt", sep = '\t', na.strings = c("dead", "missing", "MISSING", "NA", "?", "3.3."), stringsAsFactors = FALSE)You want to estimate the crown volumes for the different species and have developed equations for species in the Acacia genus:
volume = 0.16 * HEIGHT^0.8 * pi * AXIS_1 * AXIS_2and the Balanites genus:
volume = 1.2 * HEIGHT^0.26 * pi * AXIS_1 * AXIS_2For all other genera you’ll use a general equation developed for trees:
volume = 0.5 * HEIGHT^0.6 * pi * AXIS_1 * AXIS_2-
Write a function called
tree_volume_calcthat calculates the canopy volume for the Acacia species in the dataset. To do so, use an if statement in combination with thestr_detect()function from thestringrR package. The codestr_detect(SPECIES, "Acacia")will returnTRUEif the string stored in this variable contains the word “Acacia” andFALSEif it does not. This function will have to take the following arguments as input: SPECIES, HEIGHT, AXIS_1, AXIS_2. Then run the following line:tree_volume_calc("Acacia_brevispica", 2.2, 3.5, 1.12) -
Expand this function to additionally calculate canopy volumes for other types of trees in this dataset by adding if/else statements and including the volume equations for the Balanites genus and other genera. Then run the following lines:
tree_volume_calc("Balanites", 2.2, 3.5, 1.12)tree_volume_calc("Croton", 2.2, 3.5, 1.12) -
Now run the completed tree canopy function on the entire tree_data dataframe using
mapply(). Save the output of themapply()as an object, then turn this object into a dataframe.
-
-- Basic Vector --
The following code gets just the genus from strings that are scientific names and capitalizes the first letter of the genus name. The
str_extractandstr_to_titlefunctions are from thestringrpackage, which is great for working with strings.waterbird <- "cygnus olor" waterbird_genus <- str_extract(waterbird, "\\w+") waterbird_genus_cap <- str_to_title(waterbird_genus) print(waterbird_genus_cap)Modify the code to loop over a vector of multiple scientific names and print the capitalized genus names to the screen one line at a time, using the following vector:
[click here for output]waterbirds <- c("cygnus olor", "aix sponsa", "anas acuta")-- Basic Index --
The following code prints the first five whole numbers one line at a time:
for (i in 1:5){
  print(i)
}
Modify this code to accomplish each of the following tasks:
- Multiply each of the numbers 1 through 5 by 3, then print the result.
- Use the vector
odds <- seq(1, 9, by = 2)and a loop to square these numbers and print them one at a time. Choose a descriptive variable to identify the index values, such asfor (odd in odds). -
Instead of printing the values produced by this for loop, store them in a new vector named
output. The following code provides a template for doing this:output <- c() for (odd in _____) { _____ <- _____^2 output <- c(output, odds_squared) }
-- stringr --
A colleague has produced a file with one DNA sequence on each line. Download the file. Load it into R with
read.csv()and name the data framesequences.Your colleague wants to calculate the GC content of each DNA sequence (i.e., the percentage of bases that are either G or C) and knows just a little R. They sent you the following code, which will calculate the GC content for a single sequence using the
stringrpackage:sequence <- "attggc" num_g <- str_count(sequence, "g") num_c <- str_count(sequence, "c") gc_content <- (num_g + num_c) / str_length(sequence) * 100-
Convert the last three lines of this code into a function to calculate the GC content of a DNA sequence. Name that function
get_gc_content. -
Use a
forloop and your function to calculate the GC content of each sequence and store the results in a new data frame using an index. The following code will help you create this data frame:
[click here for output]# create an empty data frame with one row for each sequence gc_contents <- data.frame(gc_content = numeric(nrow(_______))) # loop over sequences using an index for the row and # store the output in the new data frame for (i in 1:nrow(__________)){ ________[i,] <- get_gc_content(sequences$____[____]) }-
-- Multiple Files --
This is a follow-up to stringr.
The same colleague wants to scale up their analysis to work on data from the PATRIC bacterial phytogenomic database. They want to know the GC content of all of the bacteria in the database and have started working initially with just a handful of archaea.
Help out by downloading the data and looping over the files to determine the GC content for each file. Once downloaded, either unzip the .zip file manually or use the
unzipfunction.Read the .fasta files in the unzipped folder into R using the ShortRead package in Bioconductor. Start by installing Bioconductor with the following code (this may take a while, so be patient):
source("https://bioconductor.org/biocLite.R")
biocLite("ShortRead")
Each fasta file contains one long sequence of DNA for an archaea species. The following code loads one sequence file, where
seqis the variable name for the data file:library(ShortRead) reads <- readFasta("archaea-dna/A-saccharovorans.fasta") seq <- sread(reads)Use
[click here for output]list.files(), withfull.namesset to true, to generate a list of the names of all the sequence files. Then create a for loop that uses the aboveseqcode to read in each sequence file. When this works, add to the loop a function that calculates GC content of each file. You can use the GC content function you wrote for stringr, but you will have to capitalize the “g” and “c” strings in thestr_countfunctions because the sequences in these files are upper case. Once this is working, create an empty data frame to store the output and fill it with values from the for loop, one column with file names and the second column with GC contents.-- Species Occurrences Elevation Histogram --
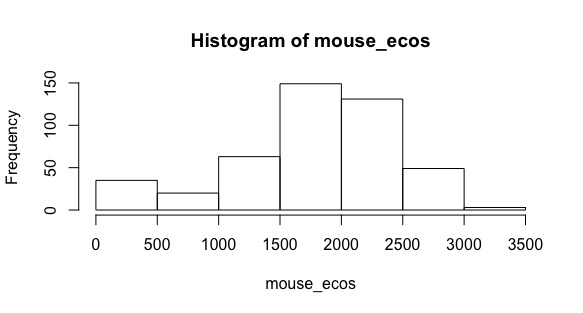
A colleague of yours is working on a project on deer mice (Peromyscus maniculatus) and is interested in what elevations these mice tend to occupy in the continental United States. You offer to help them out by getting some coordinates for specimens of this species and looking up the elevation of these coordinates.
-
Get deer mouse occurrences from GBIF, the Global Biodiversity Information Facility, using the
spoccR package, which is designed to retrieve species occurrence data from various openly available data resources. Use the following code to do so:mouse_df = occ(query = "Peromyscus maniculatus", from = "gbif") mouse_df = data.frame(mouse_df$gbif$data) -
With
dplyr, rename the second and third columns of this dataset tolongitudeandlatitude, and include only those specimens with abasisOfRecordthat isPRESERVED_SPECIMEN. -
The
rasterpackage comes with some datasets, including one of global elevations, that can be retrieved with thegetDatafunction as follows:elevation = getData("alt", country = "US") elevation = elevation[[1]] -
Turn the occurrences dataframe into a spatial dataframe, making sure that its projection matches that of the elevation dataset.
-
Extract the elevation values for all of the deer mouse occurrences and plot a histogram of them.
-
Write a function that creates a vector of elevation values for a given species name. This function should retrieve the data and put it into a dataframe, as in part 1. To limit how long this takes, add in the argument
limit = 50in theoccline. Then rename the latitude and longitude columns and remove NA rows from these columns using the following code:colnames(mouse_df)[2] <- "longitude" colnames(mouse_df)[3] <- "latitude" mouse_df = mouse_df %>% filter(!is.na(longitude) & !is.na(latitude))Turn the dataframe into a spatial object and extract the elevations for the points in the object. Test that your function works by putting in
"Peromyscus maniculatus"as the argument. -
Run this function on the following vector of mouse species names using either a loop to get a vector or an apply function to get a list of elevations for 50 occurrences of each of these 5 species.
mouse_species = c("Peromyscus maniculatus", "Peromyscus leucopus", "Peromyscus eremicus", "Peromyscus merriami", "Peromyscus boylii")
-