A colleague of yours is working on a project on deer mice (Peromyscus maniculatus) and is interested in what elevations these mice tend to occupy in the continental United States. You offer to help them out by getting some coordinates for specimens of this species and looking up the elevation of these coordinates.
Get deer mouse occurrences from GBIF, the Global Biodiversity Information Facility, using the spocc R package, which is designed to retrieve species occurrence data from various openly available data resources. Use the following code to do so:
 mouse_df = occ(query = "Peromyscus maniculatus",
                 from = "gbif")
 mouse_df = data.frame(mouse_df$gbif$data)
With dplyr, rename the second and third columns of this dataset to longitude and latitude, and include only those specimens with a basisOfRecord that is PRESERVED_SPECIMEN.
The raster package comes with some datasets, including one of global elevations, that can be retrieved with the getData function as follows:
 elevation = getData("alt", country = "US")
 elevation = elevation[[1]]
Turn the occurrences dataframe into a spatial dataframe, making sure that its projection matches that of the elevation dataset.
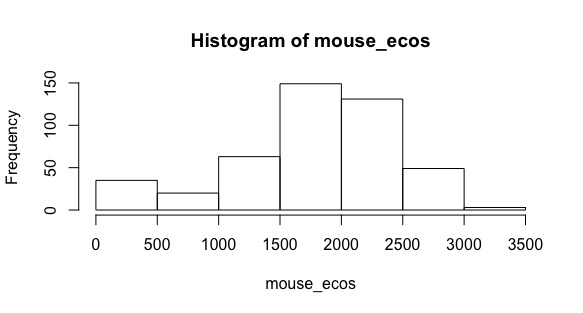
Extract the elevation values for all of the deer mouse occurrences and plot a histogram of them.
Write a function that creates a vector of elevation values for a given species name. This function should retrieve the data and put it into a dataframe, as in part 1. To limit how long this takes, add in the argument limit = 50 in the occ line. Then rename the latitude and longitude columns and remove NA rows from these columns using the following code:
 colnames(mouse_df)[2] <- "longitude"
 colnames(mouse_df)[3] <- "latitude"
 mouse_df = mouse_df %>% filter(!is.na(longitude) & !is.na(latitude))
Turn the dataframe into a spatial object and extract the elevations for the points in the object. Test that your function works by putting in "Peromyscus maniculatus" as the argument.
Run this function on the following vector of mouse species names using either a loop to get a vector or an apply function to get a list of elevations for 50 occurrences of each of these 5 species.
mouse_species = c("Peromyscus maniculatus", "Peromyscus leucopus", "Peromyscus eremicus", "Peromyscus merriami", "Peromyscus boylii")
