The high-resolution images from Canopy Height from Space
can be integrated with satellite imagery that is gathered more frequently. We
will use data collected from MODIS. One common
ecological process that can be observed from space is phenology
(or seasonal patterns) of plants.
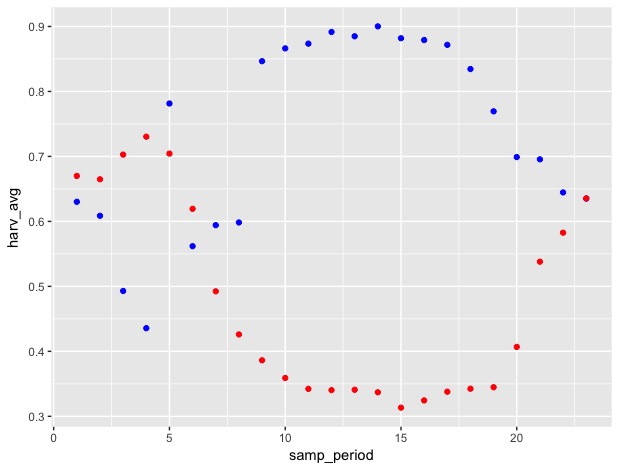
Multi-band satellite imagery can be processed to provide a vegetation index of greenness called NDVI.
NDVI values range from -1.0 to 1.0, where negative values indicate clouds,
snow, and water; bare soil returns values from 0.1 to 0.2; and green vegetation returns values greater than 0.3.
Download HARV_NDVI and SJER_NDVI and place them in a folder with the NEON airborne data. The zip contain folders with a year’s worth of NDVI sampling
from MODIS. The files are in order (and named) by date and can be organized
implicitly by sampling period for analysis.
cellStats()) for Harvard Forest and SJER
through time using different colors for the two sites.HARV_plots and SJER_plotsin NEON-airborne/plot_locations. This results in a matrix with one column per raster and one row per point. To more easily work with this data, we want to have one column with the raster names and one column per point, which you can do by transposing the matrix with the t() function. Then make this into a dataframe and turn the rownames into a column. Do this for both HARV and SJER.