

Why
Haws diploid and triploid C. gigas, high vs. low pH, 6 oysters per ploidy × pH cell (24 total, WGBS). Earlier passes (04-methylKit, 04-DSS) reported 178 ploidy / 154 pH DML. Today was about finding out whether any of that holds up. Everything is in project-oyster-oa under code/Haws/04.*, with a running summary in 04-methylation-summary.md.
The answer
No ploidy or pH effect I can detect, at any scale: single CpGs, 250 bp or 1 kb windows, gene bodies, or GO gene sets. What does stand out is that methylation tracks each oyster’s genetic background.
What was run
- 04.2 / 04.3 methylKit per-CpG. Fixed
filterByCoverageargument names and the outlier handling; Slurm version comparing overdispersion settings. - 04.4 DSS per-CpG. New pipeline with the ploidy × pH model, sample QC, 100 label permutations, a BS-SNPer SNP check, a genotype PC covariate, and runs with outlier oysters dropped.
- 04.6 methylKit regions. 250 bp and 1 kb windows, gene bodies, GSEA on NCBI GO terms (2,196 sets), all against label permutations.
- Power simulations (04.4 and 04.6). Known differences spiked into the real counts.
- 04.7 variance partitioning. Genotype vs. ploidy and pH.
Overdispersion decides everything
Without overdispersion (methylKit none) there are thousands of hits: 730–6,896 per-CpG DML and 4,500–9,000 DMRs. With MN there are about 0. The none hits are differences between individual oysters, not treatment.
Shuffled labels give as many hits as the real ones
- DSS: 187 ploidy DML from the real labels vs. a mean of 223 from 100 shuffles. pH: 185 vs. 166.
- methylKit regions: in all 72 comparisons (region set × test × threshold) the real count is inside the permutation distribution, usually near the median.
- Even with
MN, methylKit BH q < 0.05 flags 27–185 windows in every shuffle. Nominal FDR from both tools is too optimistic for this data. Only the permutations give a fair null.
The one GO lead (mitotic spindle assembly checkpoint signaling, pH, FDR 0.078) is something about half of the shuffled labelings also produce.
So the earlier 178 / 154 DML, and the annotation and enrichment built on them (07–09), are most likely false positives.
Genotype is the one clear result
All 24 samples pass technical QC (conversion 99.5%, mapping 60–62%). But genetic similarity between pairs of oysters predicts their methylation similarity (rho = 0.86), using only SNPs bisulfite conversion can’t fake.
Four oysters are genetically distinct (2H-1, 2H-2, 3H-5, 3H-2), and all four are high pH. That happens by chance about 5% of the time, so pH is partly confounded with genotype.
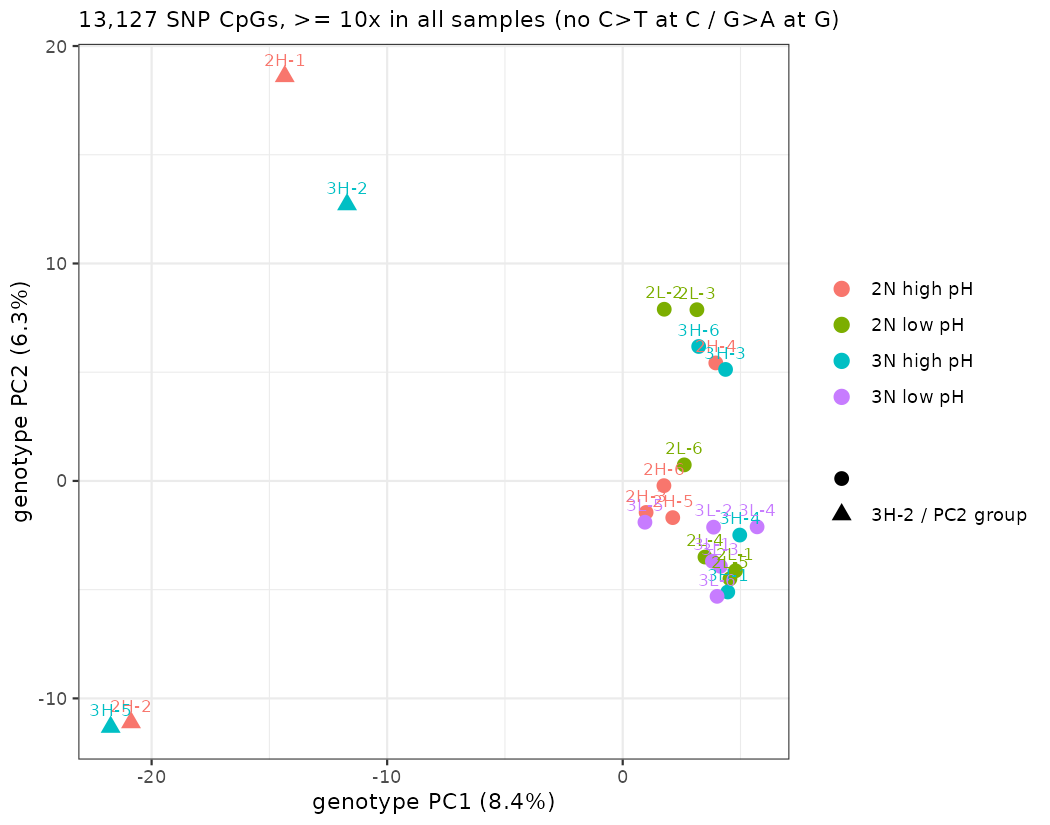
Accounting for it doesn’t uncover a hidden effect. Dropping the outliers three different ways, and a permutation that keeps the four in high pH (fixGeno4), all give counts within the null. A 9-gene pH lead in one drop set disappeared when all four were removed.
How big an effect could we have seen?
Spiked known Δ into the real data (binomial thinning, real labels, 10 replicates per Δ) and asked when the result would beat the permutation null.
| Test | Experiment-level detection limit |
|---|---|
| Single CpGs (DSS, 1,000 spiked) | ~20 points |
1 kb windows (methylKit MN, 1,000 spiked) |
~10 points |
Gene bodies (methylKit MN, 300 spiked) |
~5 points |
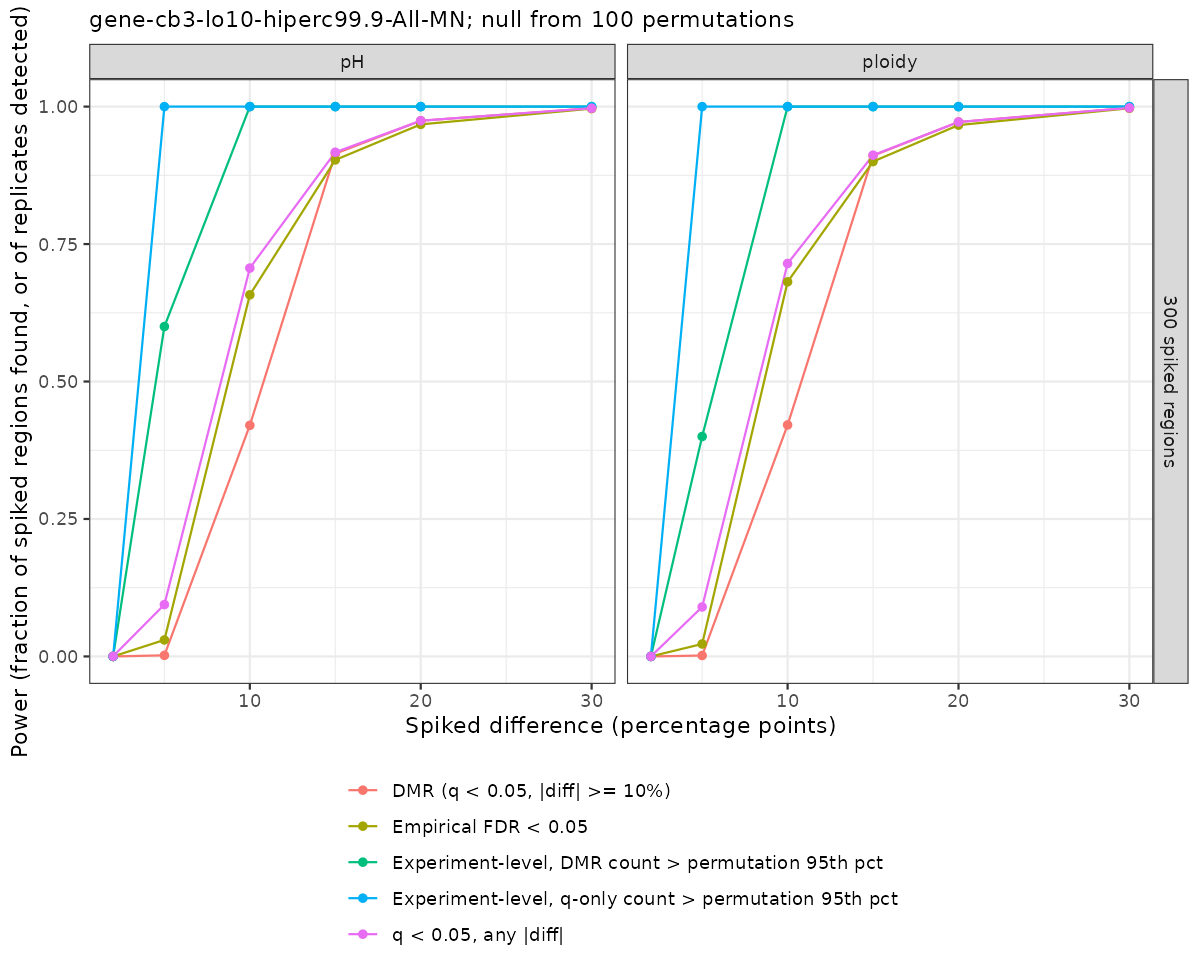
Gene bodies are the most sensitive test. The real null rules out gene-body shifts of about 5 points or more across ~1% of genes. Shifts of ~2 points can’t be seen. These are best cases, since effects are uniform within a group.
Variance partitioning
Distance-based variance partitioning and PERMANOVA on methylation distance, with 3 genotype PCs, ploidy and pH as terms (vegan).
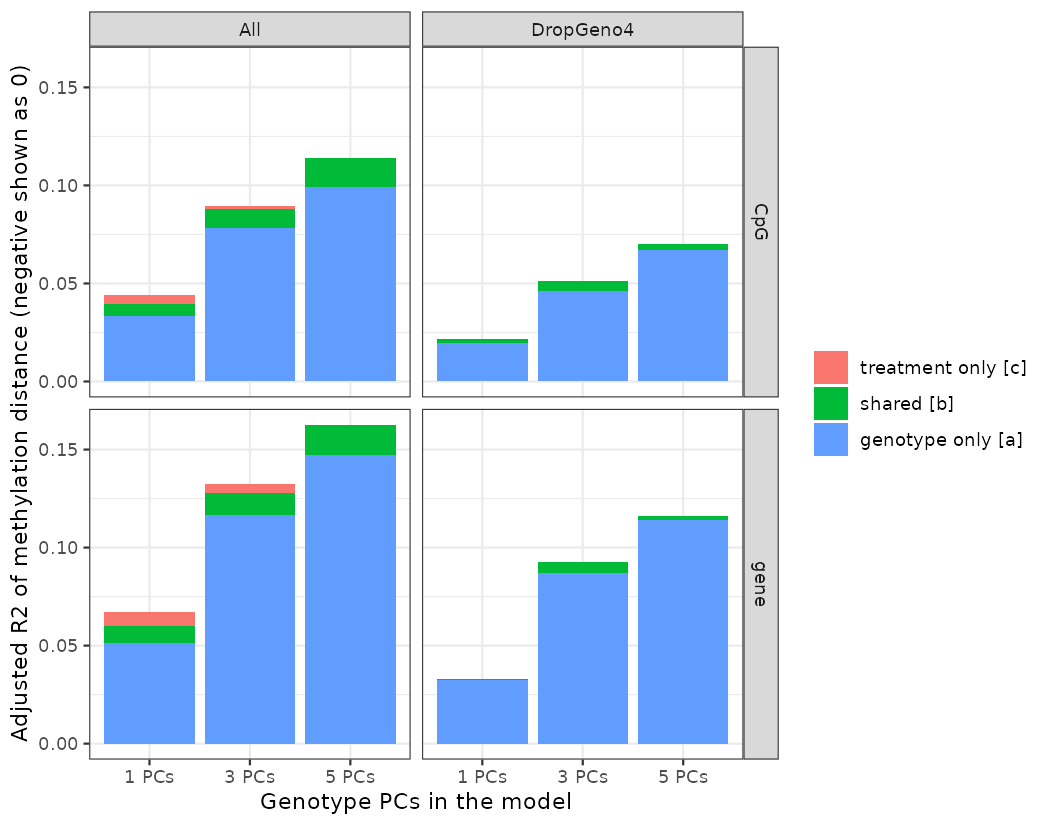
- Genotype explains 8–12% of methylation distance between oysters (Mantel r = 0.73–0.77). Without the four outliers it’s still 5–9% (r = 0.28–0.41, p < 0.001).
- Ploidy and pH explain −0.5% to 0.4%. pH is never significant in PERMANOVA. Ploidy is borderline with all 24 (p = 0.02–0.05) and gone without the outliers.
- Per feature, 4–5× more CpGs and genes are genotype-associated than chance (2× without the outliers). Treatment sits at its shuffle null.
- 85–95% is unexplained by either.
Next
- Pull the hatchery records for the four genetic outliers. If they share a source or family, the pH arm has a design confound to report.
- Flag or retract the older DML and the 07–09 annotation built on them. The 07 TE overlaps also used the wrong file.
- Write it up as a solid null with a positive genetics result. Run the exon, intron, upstream and TE region sets once against permutations to close out the region analysis.
- The genotype–methylation link (cis-mQTL-like? family?) could seed a follow-up.
per-gene-partition-*.csvis the starting point.