
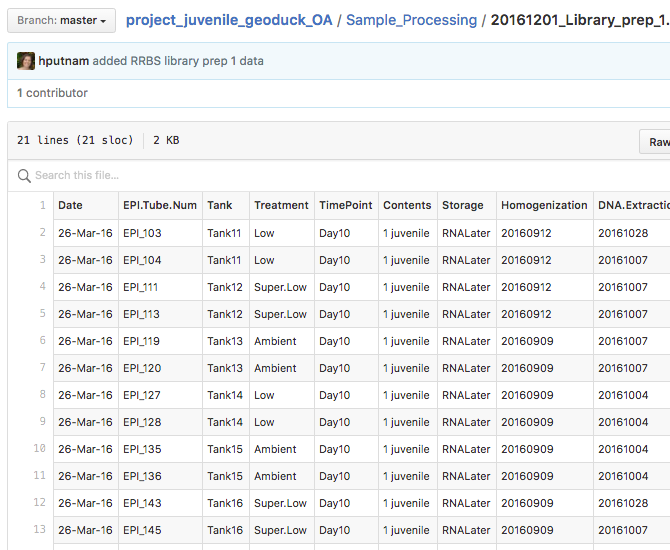
Geoduck RRBS - Batch 01 Methylation Calls
Having run the first batch of geoduck RRBS throught CoGe - Here is the mCpG file and information of how these files were generated.
Here are the CpG methylation files from CoGe…
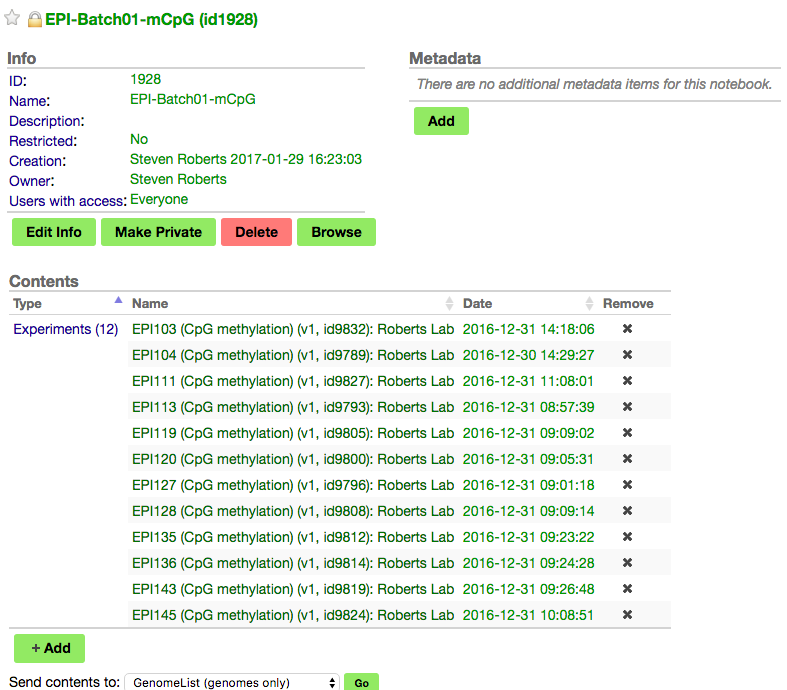
https://genomevolution.org/coge/NotebookView.pl?lid=1928
Note that these files went through..
https://genomevolution.org/wiki/index.php/Methylation_Analysis_Pipeline
which certainly worth having a look at..
Generated by CoGe's Methylation Analysis Pipeline	Link
bismark_methylation_extractor --ignore 0 --ignore_r2 --ignore_3prime 0 --ignore_3prime_r2
A number of files are generated per library.
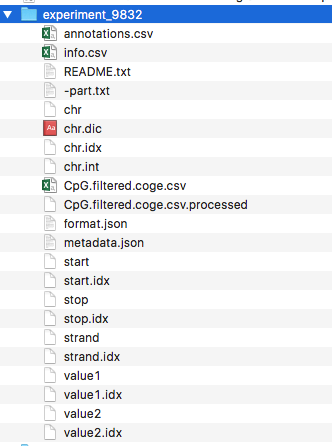
In this particular example the file CpG.filtered.coge.csv look like the following:
scaffold121673,6550,6550,-1,0.125,8
scaffold121673,6371,6371,-1,0.0,7
scaffold121673,6559,6559,-1,0.0,5
scaffold121673,6486,6486,-1,0.0,8
scaffold121673,6355,6355,-1,0.0,6
scaffold121673,5310,5310,1,0.0,7
scaffold121673,5682,5682,1,0.0,5
scaffold121673,16207,16207,1,0.0,9
scaffold121673,6515,6515,-1,0.0,8
scaffold121673,6488,6488,-1,0.125,8
scaffold121673,5326,5326,1,0.0,7
scaffold121673,6523,6523,-1,0.0,8
scaffold121673,16123,16123,1,0.0,8
scaffold121673,5668,5668,1,0.16666666666666666,6
scaffold121673,6527,6527,-1,0.0,8
scaffold121673,16118,16118,1,0.0,8
scaffold121673,6533,6533,-1,0.0,8
with about 245k lines.
Based on link above that describes the pipeline.
Output Files In addition to direct visualization files are downloadable to enable downstream analyses (differentially methylated region detection, etc.). Individual files in .csv format for each sequence context are downloadable from ExperimentView. These files comply with CoGe’s LoadExperiment format for quantitative data and contain the following information:
#CHR,POSITION,POSITION,STRAND,METHYLATION(0-1),DEPTH
Chromosome IDs will match those of the genome to which reads have been aligned, position is of each cytosine, strand (-1 for bottom, 1 for top), percent methylation is expressed as a decimal between 0 and 1, and read depth at each methylation call will be shown as an integer (filtered for the minimum coverage specified during the analysis pipeline).
The BAM alignment can be downloaded in ExperimentView. Sequence and quantitative information for the visible region can also be downloaded while browsing the genome.