
Hemato qPCR in R
02-Crab-qpcr
library("dplyr")
##
## Attaching package: 'dplyr'

## The following objects are masked from 'package:stats':
##
##     filter, lag

## The following objects are masked from 'package:base':
##
##     intersect, setdiff, setequal, union
qpcr <- read.csv("../data/hematqpcr_crabRNA.csv")

head(qpcr)
##       Uniq_ID  FRP tube_number trtmnt_tank sample_day infection_status maturity
## 1 6101_206_12 6101         206        cold          2                0        I
## 2 6101_415_26 6101         415        cold         17                0        I
## 3   6101_84_9 6101          84        <NA>          0                0        I
## 4   6102_18_9 6102          18        <NA>          0                0        I
## 5   6102_18_9 6102          18        <NA>          0                0        I
## 6 6102_439_26 6102         439        cold         17                0        I
##   RNA_ng.ul total.yield_ng elution_vol_ul org_sample_ul target sq_all.runs_mean
## 1     19.90         258.70             15            70 Hemato           42.225
## 2     12.30         159.90             15            70 Hemato           42.225
## 3     34.70         451.10             15            70 Hemato           42.225
## 4      4.46          57.98             15            70 Hemato           32.544
## 5      4.46          57.98             15            70 Hemato           32.544
## 6     21.60         280.80             15            70 Hemato           32.544
##   sample_pos.neg Library_ID
## 1            pos     329775
## 2            pos     329777
## 3            pos         NA
## 4            neg         NA
## 5            pos         NA
## 6            neg     304428
Want to get average sqallmeans for each FRP…
avQpcr <- group_by(qpcr, FRP) %>%
summarize(avg_sq = mean(sq_all.runs_mean, na.rm=TRUE), trtmnt_tank, infection_status, maturity, sample_pos.neg) %>%
distinct_all() %>%
filter(trtmnt_tank == "cold" | trtmnt_tank == "warm" | trtmnt_tank == "ambient")
## `summarise()` has grouped output by 'FRP'. You can override using the `.groups` argument.
avQpcr
## # A tibble: 210 x 6
## # Groups:   FRP [172]
##      FRP avg_sq trtmnt_tank infection_status maturity sample_pos.neg
##    <int>  <dbl> <chr>                  <int> <chr>    <chr>
##  1  6101   42.2 cold                       0 I        pos
##  2  6102   32.5 cold                       0 I        neg
##  3  6102   32.5 cold                       0 I        pos
##  4  6103  183.  cold                       1 I        pos
##  5  6104   18.6 cold                       0 I        neg
##  6  6104   18.6 cold                       0 I        pos
##  7  6106   78.8 cold                       0 M        pos
##  8  6107   61.2 ambient                    0 M        neg
##  9  6107   61.2 ambient                    0 M        pos
## 10  6108   71.1 cold                       1 I        pos
## # … with 200 more rows
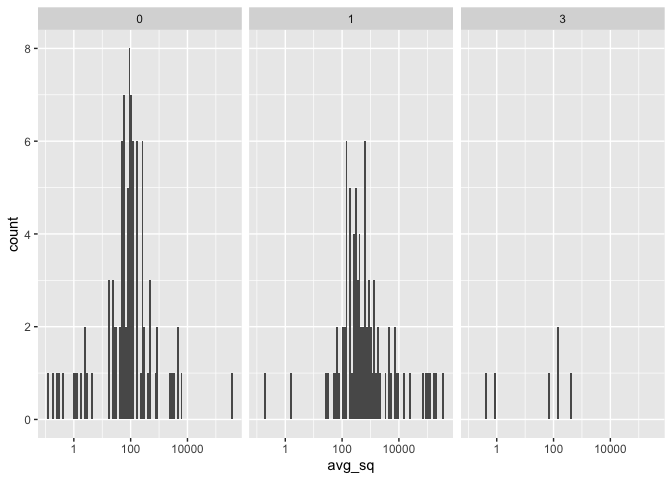
library(ggplot2)
ggplot(avQpcr, aes(x = avg_sq)) +
  geom_histogram(bins = 100) +
  scale_x_log10() +
  facet_grid(~infection_status)
## Warning: Transformation introduced infinite values in continuous x-axis

## Warning: Removed 26 rows containing non-finite values (stat_bin).
Written on June 10, 2021