
Proteomic Visualization
Here is how one might go about visualizing Proteomic Data. This is based on a list of proteins Laura found to be different in geoducks in eel grass (as opposed to not being in eel grass).
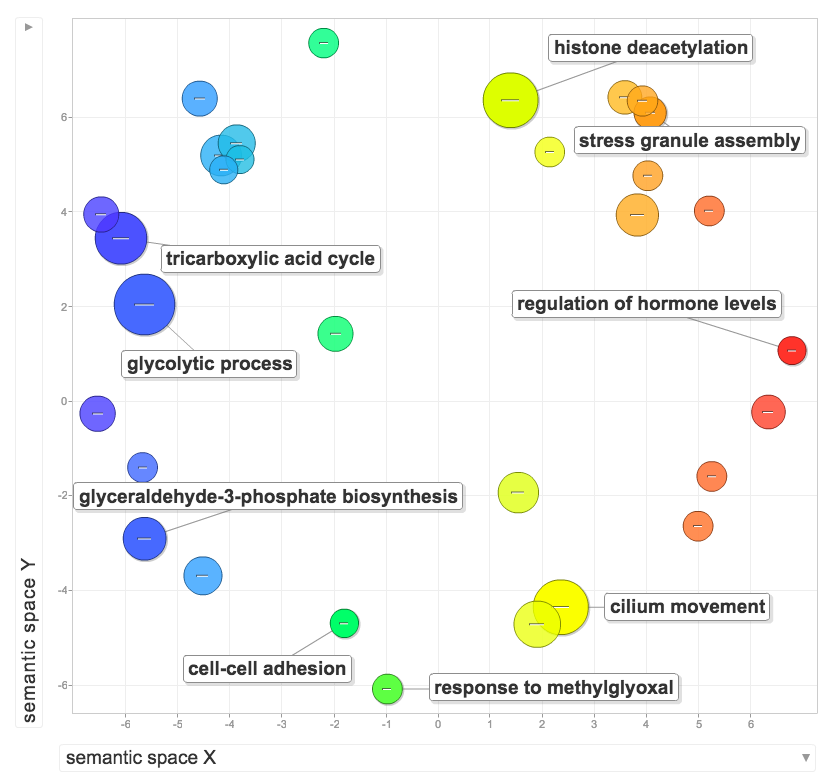
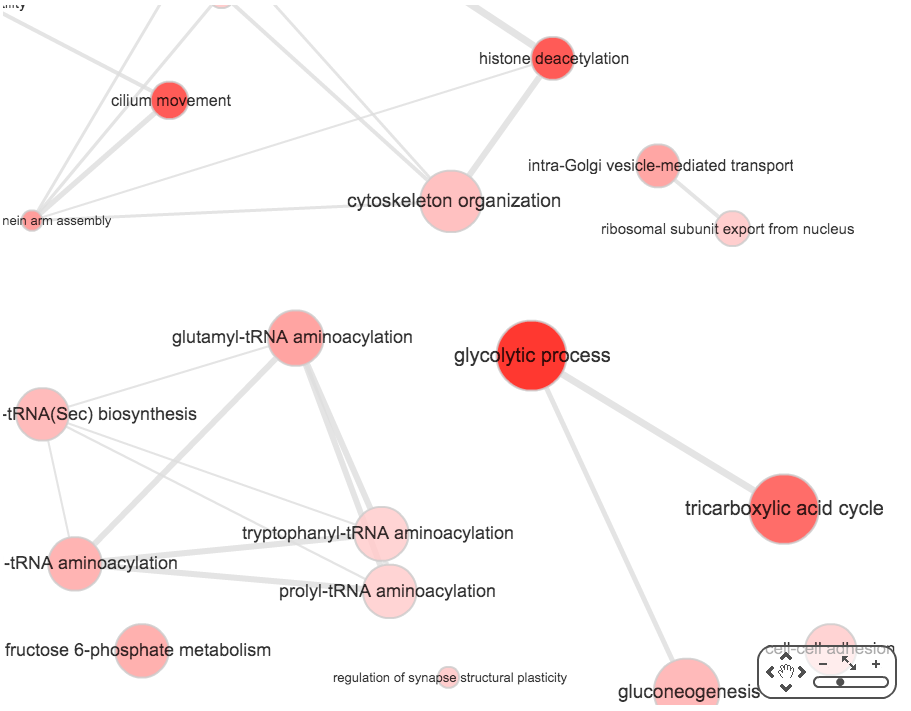

List for C/P in Revigo
GO:0006096	3.55E-07
GO:0003341	5.43E-06
GO:0016575	5.43E-06
GO:0006099	2.09E-05
GO:0030317	1.75E-04
GO:0046166	6.12E-04
GO:0036159	7.54E-04
GO:0006424	0.001212694
GO:0006891	0.001373658
GO:0006002	0.002974623
GO:0006434	0.00412513
GO:0006890	0.004570259
GO:0006418	0.004750795
GO:0006094	0.006652423
GO:0006108	0.006938895
GO:0097056	0.006938895
GO:0010501	0.007019626
GO:0010971	0.010402537
GO:0006476	0.010402537
GO:0007010	0.010491997
GO:0006098	0.012365797
GO:0007018	0.013530396
GO:0034063	0.014477021
GO:0007409	0.01999861
GO:0033962	0.024310719
GO:0007051	0.024310719
GO:0051595	0.0285778
GO:0051823	0.0285778
GO:0015966	0.0285778
GO:0000054	0.0285778
GO:0090611	0.0285778
GO:0021873	0.0285778
GO:0045769	0.0285778
GO:1901675	0.0285778
GO:0098609	0.038600332
GO:0006433	0.042560625
GO:0051653	0.042560625
GO:0006436	0.042560625
GO:0010817	0.042560625
Some files -
Revigo treempap R code
Revigo plot R code
David BP Fat output

Written on March 19, 2017