
methylation distance matrix
Here is an attempt to pull relatedness / distance matrix from methylkit data…
library(tidyverse)
library(methylKit)
sample metadata
| Sample.ID | OldSample.ID | Treatment | Sex | TreatmentN | Parent.ID |
|---|---|---|---|---|---|
| 12M | S12M | Exposed | M | 3 | EM05 |
| 13M | S13M | Control | M | 1 | CM04 |
| 16F | S16F | Control | F | 2 | CF05 |
| 19F | S19F | Control | F | 2 | CF08 |
| 22F | S22F | Exposed | F | 4 | EF02 |
| 23M | S23M | Exposed | M | 3 | EM04 |
| 29F | S29F | Exposed | F | 4 | EF07 |
| 31M | S31M | Exposed | M | 3 | EM06 |
| 35F | S35F | Exposed | F | 4 | EF08 |
| 36F | S36F | Exposed | F | 4 | EF05 |
| 39F | S39F | Control | F | 2 | CF06 |
| 3F | S3F | Exposed | F | 4 | EF06 |
| 41F | S41F | Exposed | F | 4 | EF03 |
| 44F | S44F | Control | F | 2 | CF03 |
| 48M | S48M | Exposed | M | 3 | EM03 |
| 50F | S50F | Exposed | F | 4 | EF01 |
| 52F | S52F | Control | F | 2 | CF07 |
| 53F | S53F | Control | F | 2 | CF02 |
| 54F | S54F | Control | F | 2 | CF01 |
| 59M | S59M | Exposed | M | 3 | EM01 |
| 64M | S64M | Control | M | 1 | CM05 |
| 6M | S6M | Control | M | 1 | CM02 |
| 76F | S76F | Control | F | 2 | CF04 |
| 77F | S77F | Exposed | F | 4 | EF04 |
| 7M | S7M | Control | M | 1 | CM01 |
| 9M | S9M | Exposed | M | 3 | EM02 |
myobj_m = processBismarkAln(location = file.list_male,
  sample.id = list("12M","13M","23M","31M","48M","59M","64M","6M","7M","9M"),
  assembly = "cv",
  read.context="CpG",
  mincov=2,
  treatment =  c(1,0,1,1,1,1,0,0,0,1))
save(myobj_m, file = "../analyses/myobj_m")
cd ../output/55-methylation-matrix

curl -O https://gannet.fish.washington.edu/seashell/bu-github/2018_L18-adult-methylation/analyses/myobj_m
load("../output/55-methylation-matrix/myobj_m")
filtered.myobj=filterByCoverage(myobj_m,lo.count=10,lo.perc=NULL,
hi.count=NULL,hi.perc=98)
meth_filter=methylKit::unite(filtered.myobj, min.per.group=NULL, destrand=TRUE)
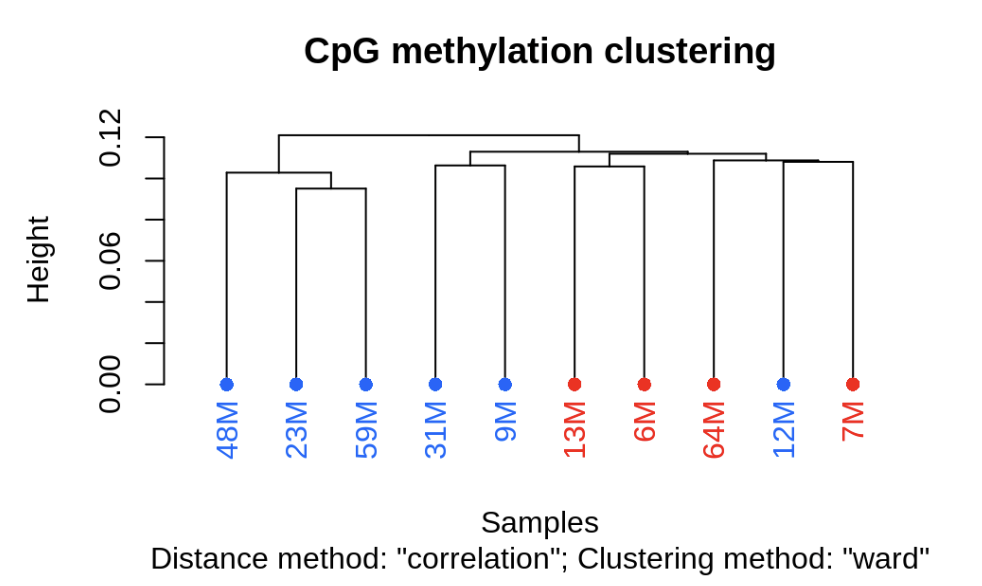
clusterSamples(meth_filter, dist="correlation", method="ward", plot=TRUE)
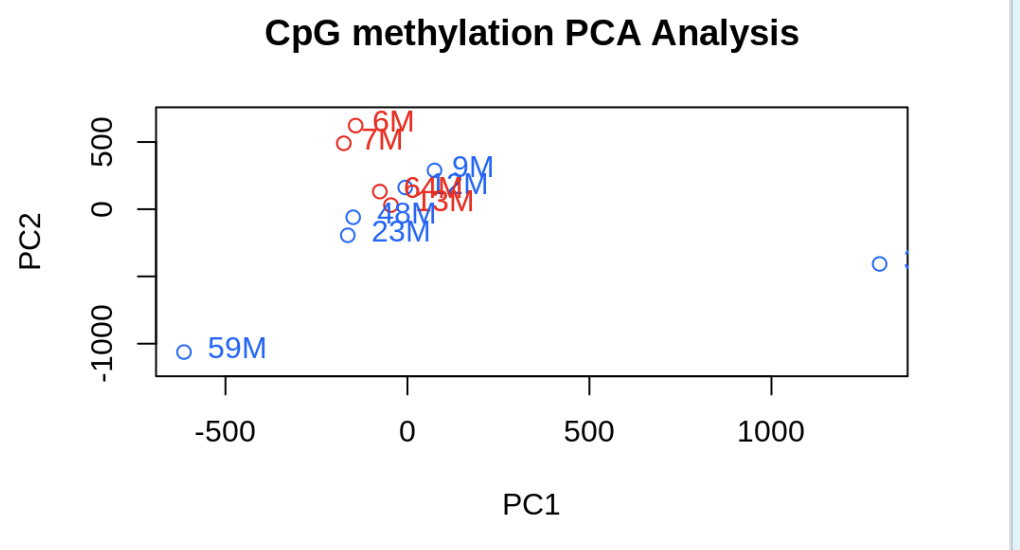
PCASamples(meth_filter)
Laura’s code
perc.meth=percMethylation(meth_filter, rowids=T)
# Save % methylation df to object and .tab file
save(perc.meth, file = "../analyses/male-perc.meth") #save object to file
#load(file = "../analyses/methylation/R-objects/perc.meth") #load object if needed
#write.table((as.data.frame(perc.meth) %>% tibble::rownames_to_column("contig")), file = "../analyses/male-percent-meth.tab", sep = '\t', na = "NA", row.names = FALSE, col.names = TRUE)
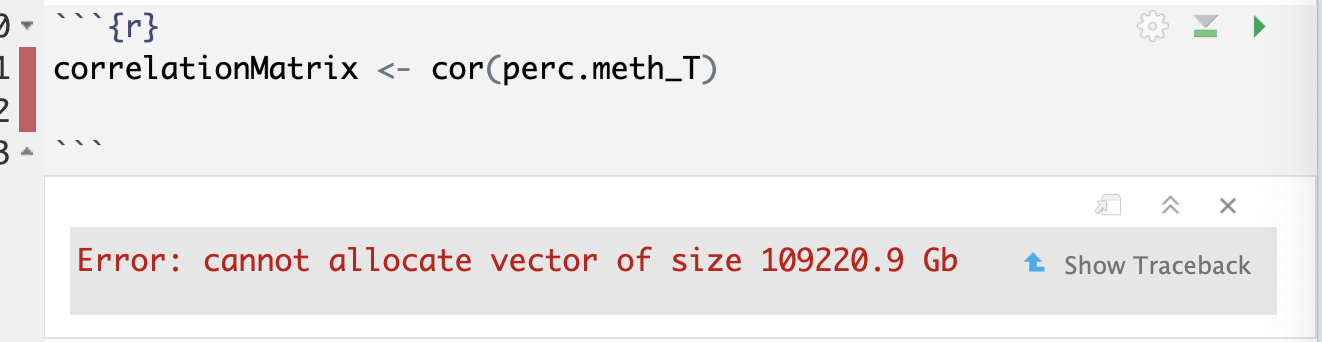
perc.meth_T <- t(perc.meth)
correlationMatrix <- cor(perc.meth_T)
distanceMatrix <- dist(perc.meth_T)
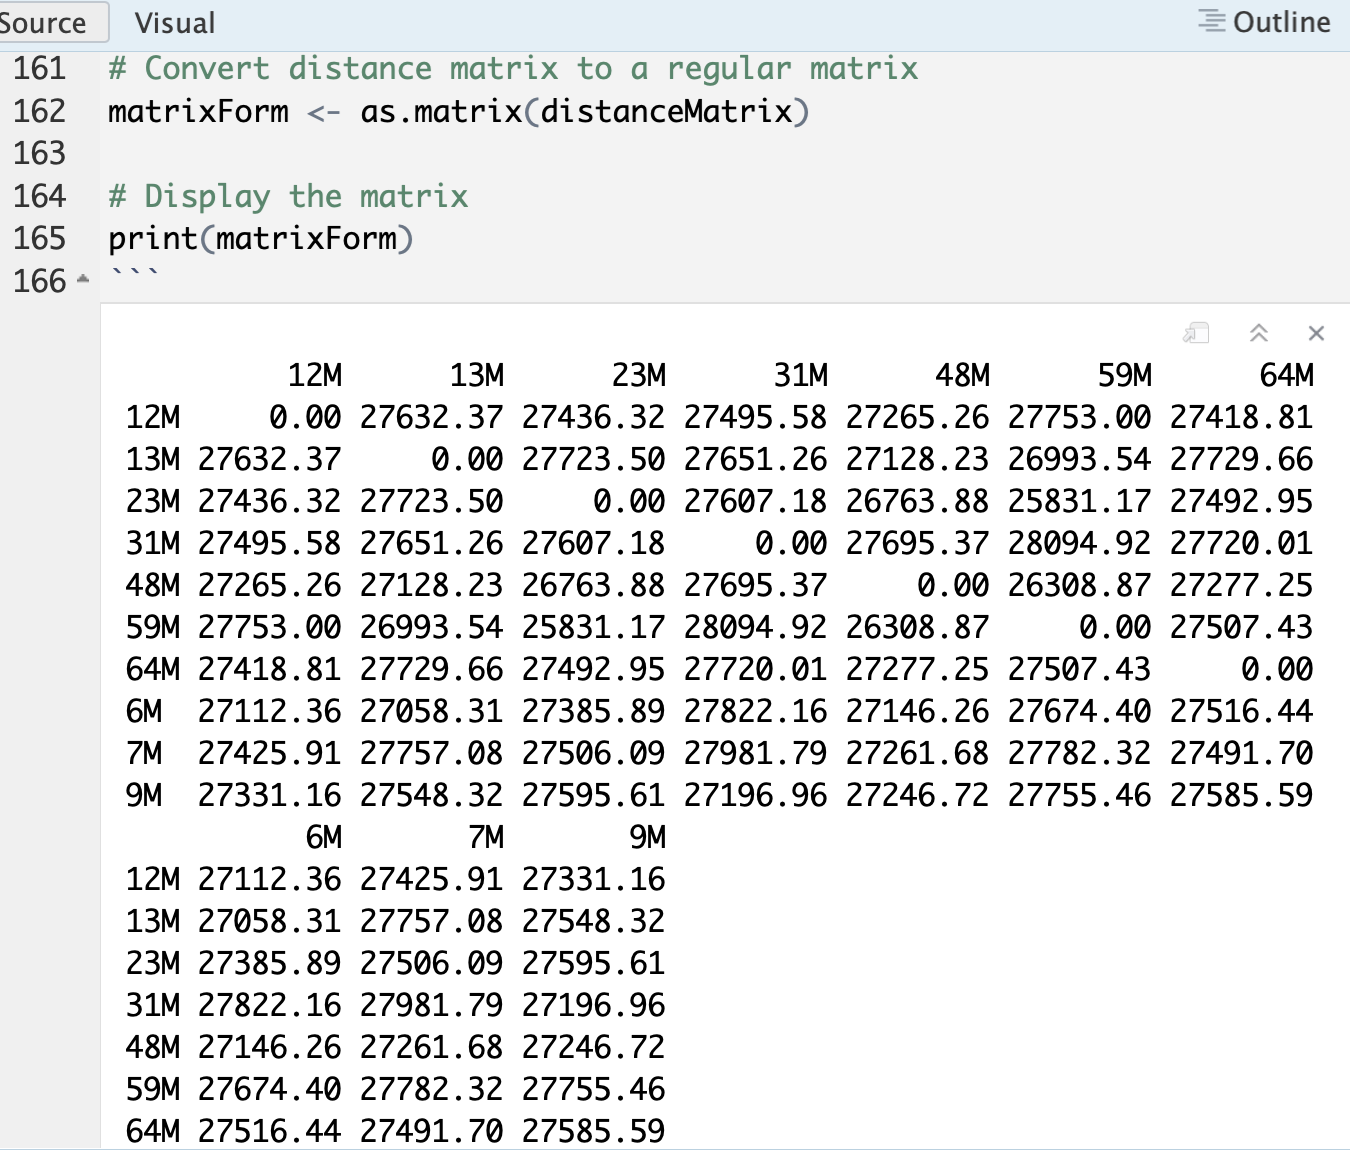
# Convert distance matrix to a regular matrix
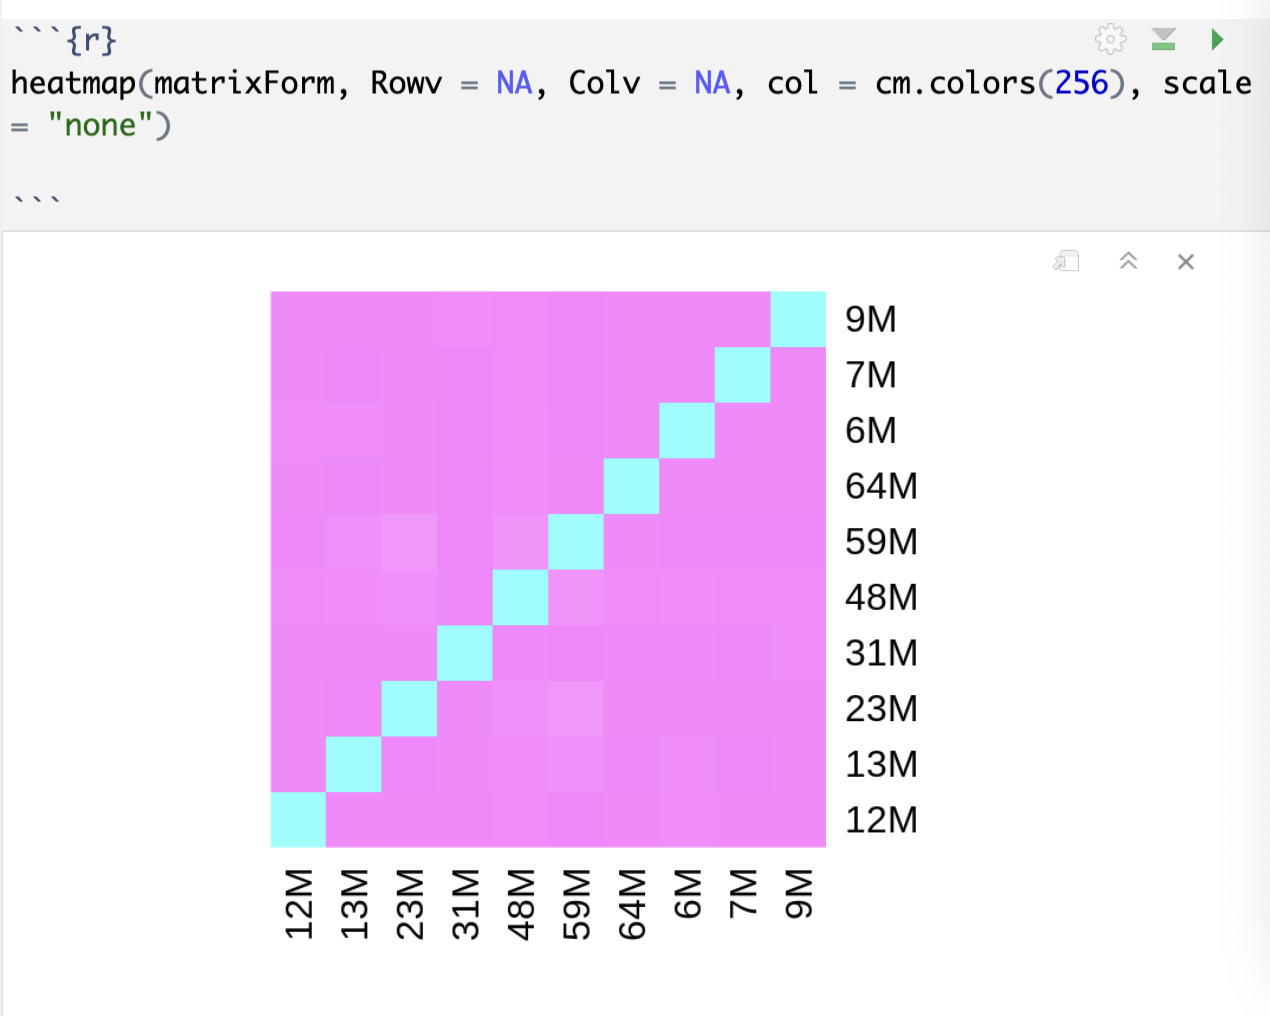
matrixForm <- as.matrix(distanceMatrix)
# Display the matrix
print(matrixForm)
heatmap(matrixForm, Rowv = NA, Colv = NA, col = cm.colors(256), scale = "none")
dataFrameForm <- as.data.frame(matrixForm)
print(dataFrameForm)
Written on August 15, 2023