
Single Cell Library Comparisons
Looking at number of cell, and expression data.
gast <- read.delim("../data/gastrula_geneBYcellsexpressed.txt", sep = "\t")
bla <- read.delim("../data/CPbla_geneBYcellsexpressed.txt", sep = "\t")
lc <- full_join(bla, gast, by = "id")
lc %>%
  filter(num_cells_expressed.x == 0, num_cells_expressed.y > 5)
lc %>%
  filter(num_cells_expressed.y == 0, num_cells_expressed.x > 5)
Using the given filters there are 1637 genes not expressed in blastula stage and expresses >5 cells in gastrula library.
And 260 genes expressed in greater that 5 cells in blastula library and not expressed in gastrula library.
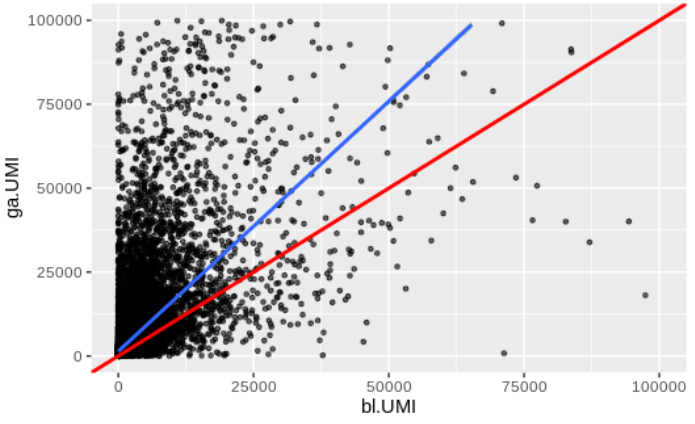
Also have an expression comparison but not quite sure how to come up with a statistic.
Written on August 23, 2022